3M COMPANY - MMM
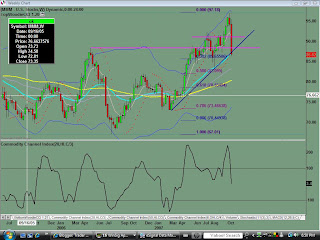
Monthly chart shows higher into $96.82 was made with regular divergence in momentum indicator. The move up shows five waves. IF we have 5 waves up, THEN look for a retracement of that range.
Weekly chart shows heavy selling the past week, with price breaking the UTL in place, and closing below the prior key LIS of $88.31.
Daily chart shows the change in investor sentiment, as investors gapped down the price below prior support and selling off hard into the close. The low happened to coincide with the .786 fib level.
Saturday, October 20, 2007
MMM Analysis for 10.20,2007
Posted by
TraderZ
at
10/20/2007 04:06:00 PM
![]()
Labels: MMM
Subscribe to:
Post Comments (Atom)

No comments:
Post a Comment