Is the worst of the subprime market behind us? Bill Carrigan seems to think so. Let's see what the charts say.
PHLX HOUSING SECTOR INDEX - $HGX
Monthly chart shows the index has retraced to the .886 fib level in January 2008, where it found short term support. The high of the index was indeed made in July 2005, and prices have been falling sharply ever since. The index continues to remain weak, despite having made a bottom in January 2008. No buy/long signal/pattern evident on this timeframe.
Weekly chart shows resistance and continues to be below the down trendline in place. Index is below all its key moving averages.
Daily chart shows consolidation/trading range, with a test of high made, where bulls were soon overcome by bears. Look for continued weakness and test of the low and lower. The rebound noted by Bill Carrigan is just short term support. The pattern suggests lower, and the selling is NOT done yet.
Friday, February 29, 2008
Is Worst of Subprime Market Behind Us?

Sunday, January 20, 2008
$HGX Analysis for 01.20.2008
HOUSING INDEX - $HGX
Monthly chart shows the index has retraced to the .886 fib level where it found short term support. Index remains well below all key moving averages with no buy signal/pattern in sight on this timeframe.
Weekly chart shows down trendline remains intact. There is regular divergence noted on the CCI momentum indicator for now. No buy signal/pattern as of yet on this timeframe.
Daily chart shows short term support off the .886 fib level (as seen on monthly chart). Overhead resistance is right at a key LIS and prior support - old support becomes new resistance. Bear flag pattern in place, creating a small consolidating range the past 2 weeks. IF this is a bear flag, THEN look for lower low to follow. No buy signal/pattern on this timeframe either.
Sunday, December 02, 2007
$HGX Analysis for 12.02.2007

Monthly chart shows no buy signal in sight.
Weekly chart shows downtrend remains intact. Last week's trading action shows early buyers stepping back into housing stocks. No confirmed buy signal as of yet.
Daily chart shows early buying activity. Short term trend is up, but longer term trend remains down for now.
Friday, November 17, 2006
$HGX Analysis 11.17.2006
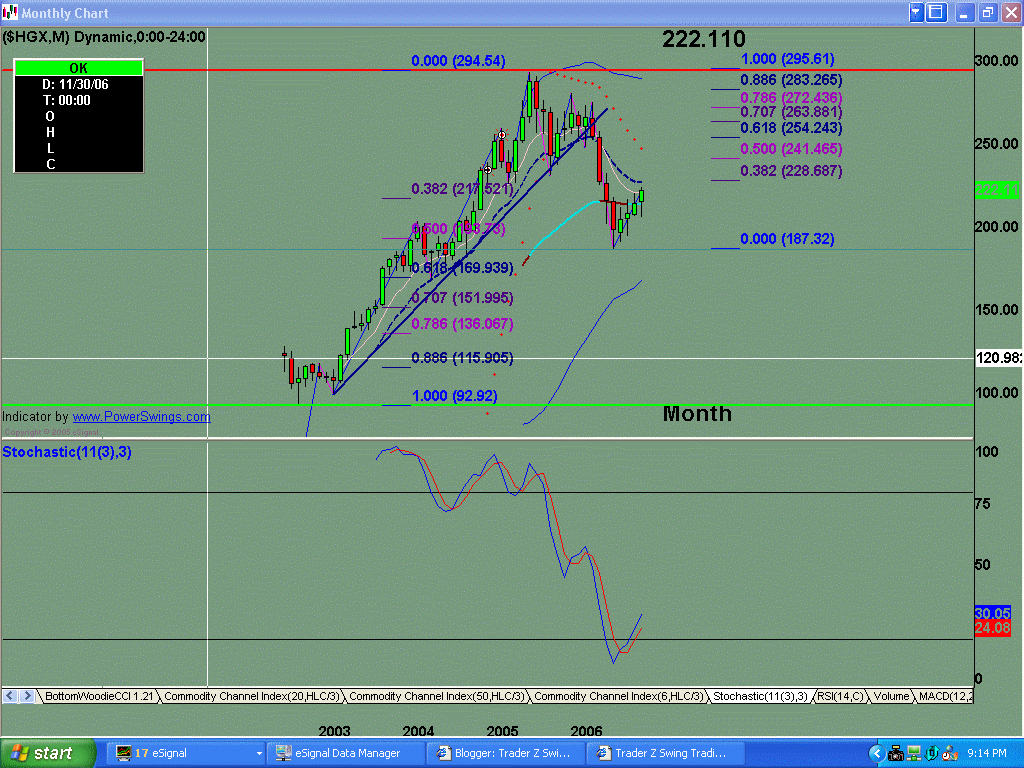
Index showing upside momentum the past 4 months. Looking for the .382 fib level and prior support as initial target and possible resistance.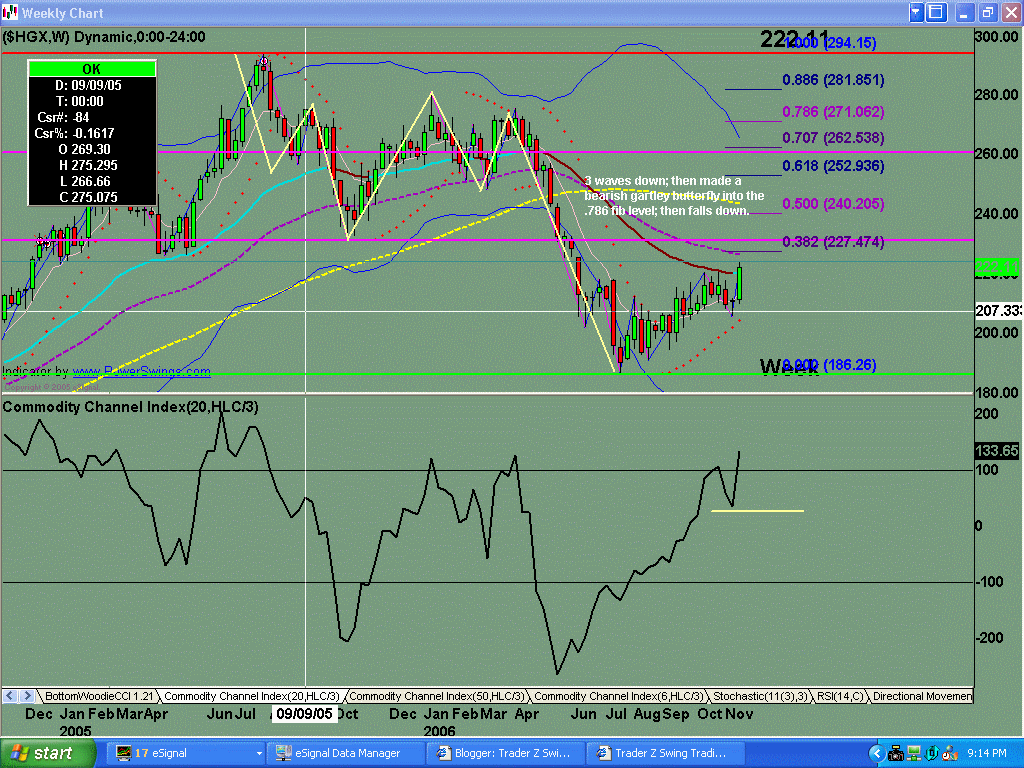
Index ended this week on a strong note, and close to upside resistance.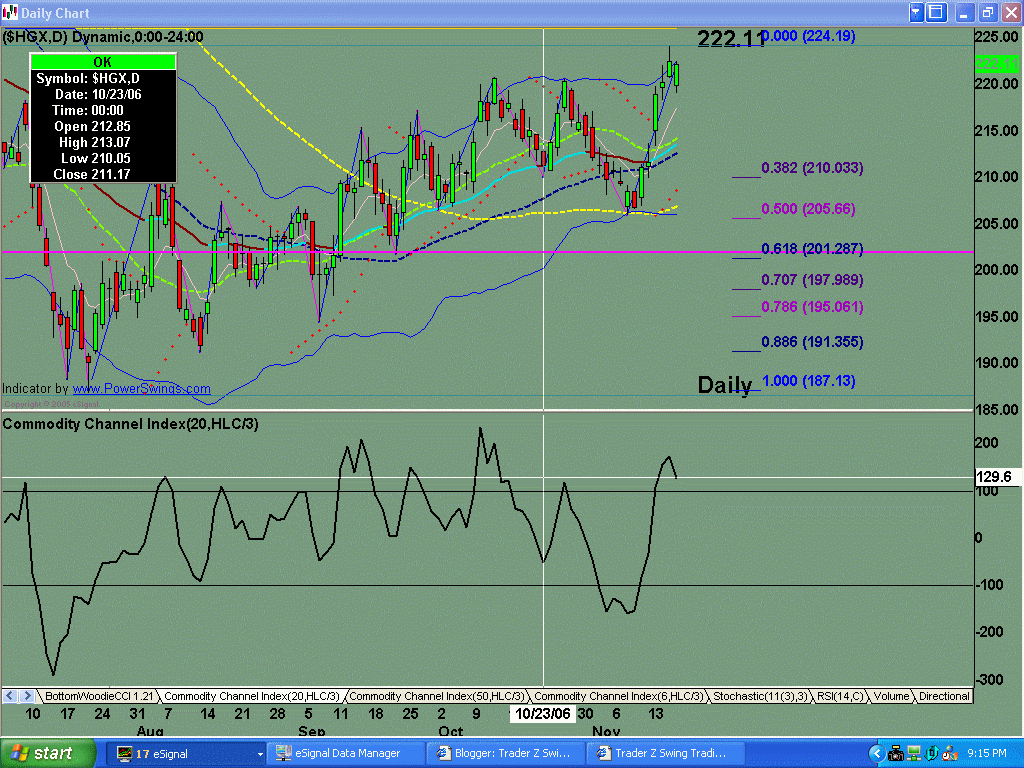
Watch for signs of pullback and retracement.

