PFIZER - PFE
Monthly chart shows stock stuck in a consolidation range lasting several years. Jim Cramer called PFE a buy on August 15, 2007. For those who bought on his recommendation, they would not happy campers. Price is currently below key LIS at the $25 range, and heading towards its lows. No buy pattern/signal on this timeframe for bulls. Sell signal remains in effect.
Weekly chart shows increased selling pressure, with last week's trading activity completely wiping out the prior week's gains. Early bulls were met with bears at the key LIS .... where "old support becomes new resistance". No buy signal/pattern evident on this timeframe.
Daily chart shows strong selling on with Friday's trading session, capping a week full of weakness and selling pressure. IF the low holds, THEN look for continued consolidation, and another opportunity to exit any longs. Any bounce in price is a good opportunity to enter shorts.
Saturday, February 09, 2008
PFE Update on 02.09.2008

Wednesday, August 15, 2007
PFE Analysis for 08.15.2007

Monthly chart shows a bearish consolidation pattern. Price is currently below all key moving averages. Look for more downside movement, with a test of the current low at the $20.30 area.
The weekly chart shows more clearly the corrective nature of the pattern. A break of the current support at $23.30ish will initially target the .786 fib area at $22. Then look for a test of the lows and lower.
The daily chart shows price trending below all key moving averages, with the 34ema as resistance.
Saturday, December 09, 2006
PFE Update for 12.09.2006
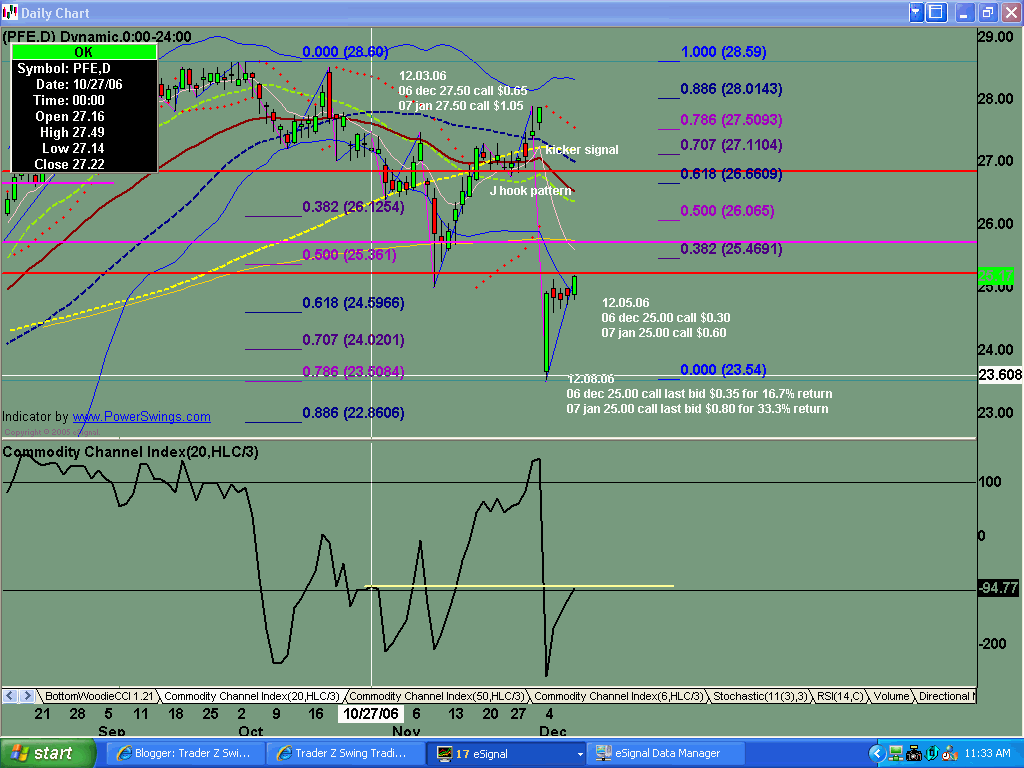
Overnite news brought all the panic sellers out at the open, gapping it down to .786 fib level where buyers started back into stock. Friday ended with more buyers, taking stock up over $25.00. Both call options bought now up with double digit returns. Current support is both a .618 fib and a .786 fib level, creating a bullish gartley butterfly pattern.
Sunday, December 03, 2006
PFE Analysis 12.03.2006
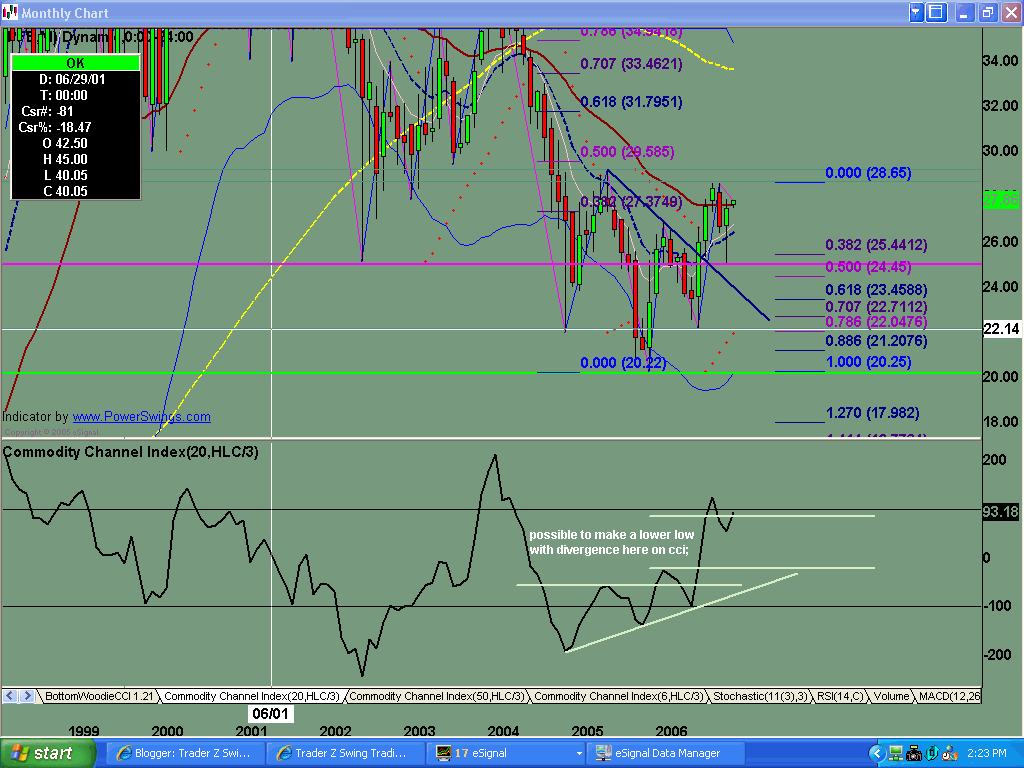
Inverted head and shoulders pattern with forceful break of the neckline. Profit taking and retracement to successfully test the neckline. November tested the prior back end support and LIS at $35.25 area. A nice hammer or bullish harami showed that more buyers stepped into the stock last month.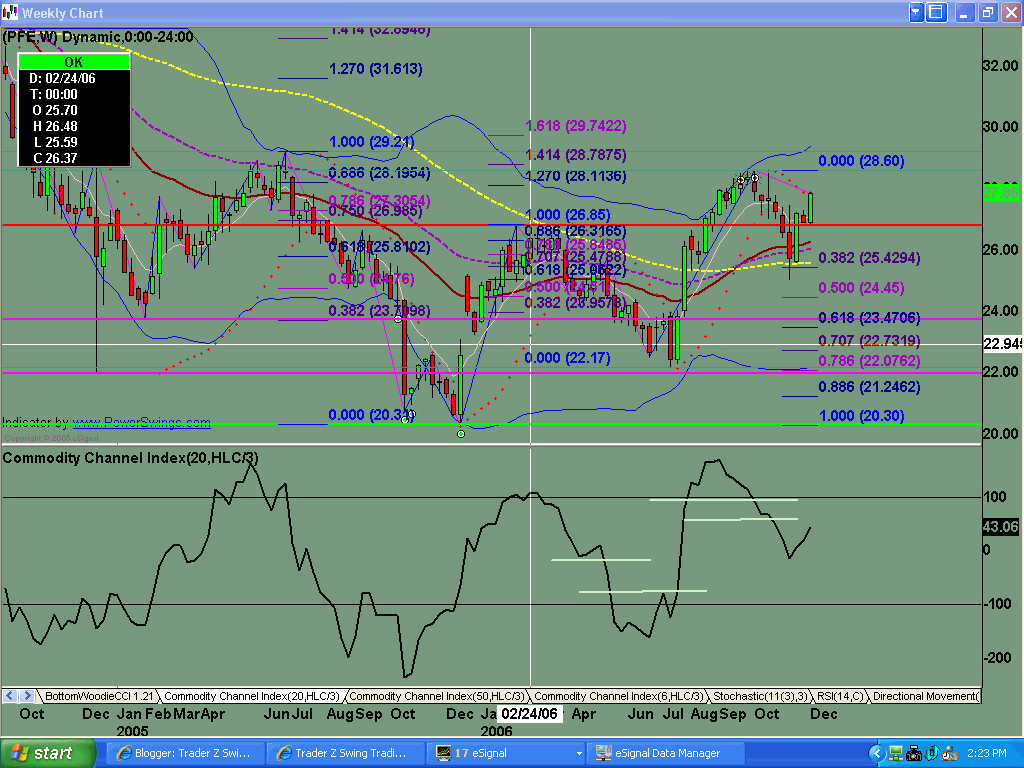
Last week saw a successful test of support at the $26.75 LIS. 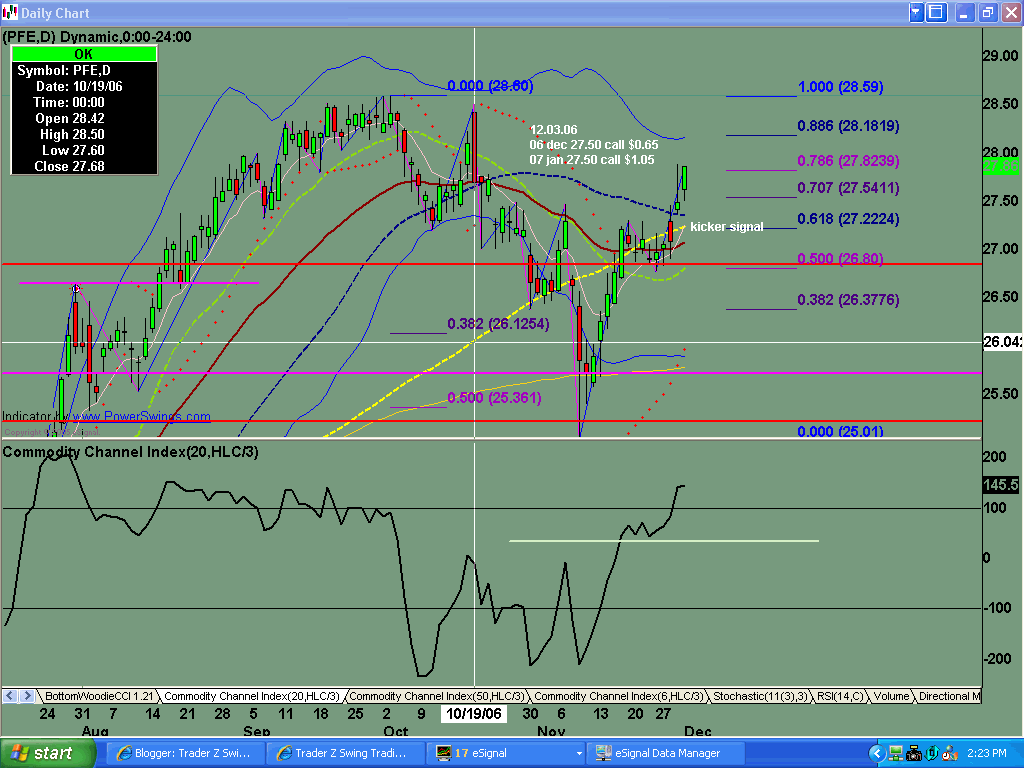
J hook pattern formed with retracement as buyers took profits with the nice run up from the $25.00 low. Look for test of high and higher.

