CAMPBELL SOUP CO. - CPB
Monthly chart shows price below 8ema currently, but support is right below at the 34ema.
Weekly chart shows price below all key moving averages, with resistance currently at $36.75 to - $37.
Daily chart small consolidation range. Friday brought out the sellers as they gapped the price down at the open, and closed it on its lows at the end of the trading session. Look for further weakness ... a test of the lows perhaps before a final break and lower.
Showing posts with label CPB. Show all posts
Showing posts with label CPB. Show all posts
Sunday, October 21, 2007
CPB Analysis For 10.21.2007

Tuesday, December 05, 2006
CP Analysis 12.05.06

Superstockpicker.com made a buy recommendation on CP today. The monthly chart shows the stock to have been in a trading range since May 2006. The stock made a double top, but no strong selling resulted. November showed equilibrium between buyers and sellers, with little to no gain in price.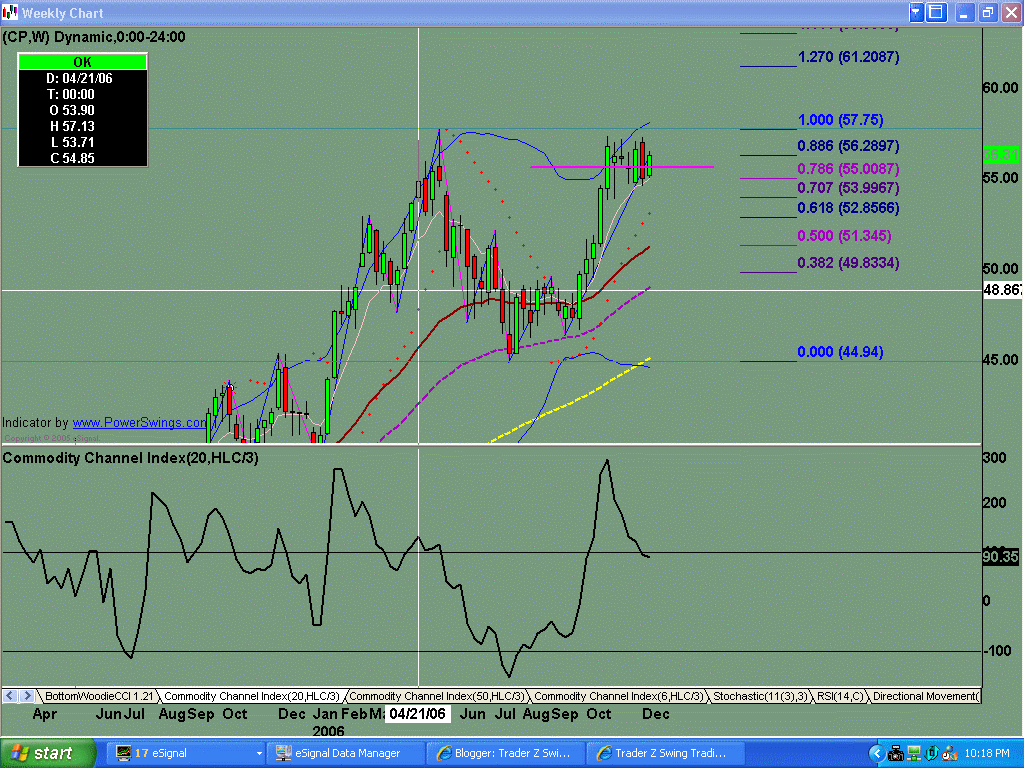
Weekly chart showed some profit taking. Looks like a bull flag formation here.
Buyers came out in force today; making a gap open and closing near the highs for the day. Support is currently at the 34ema. Possible wave 4 here; a higher higher would make wave 5.
Subscribe to:
Posts (Atom)

