BOEING CO. - BA
Monthly chart shows selling the last 2 months. Price currently below the 8ema.
Weekly chart shows a double top made at the $107.83 high. Uptrend line has now been broken. Friday's price action found support off a key LIS and prior resistance level at $89.99 area. Will old resistance become new support?
Daily chart shows price below all key moving averages and downside momentum remains strong. IF the $89.99 area does not hold as support, THEN next downside target is the next key LIS at $71 range.
Showing posts with label BAX. Show all posts
Showing posts with label BAX. Show all posts
Saturday, November 17, 2007
BA Analysis for 11.17.2007

Monday, December 11, 2006
BAX Analysis for 12.11.2006
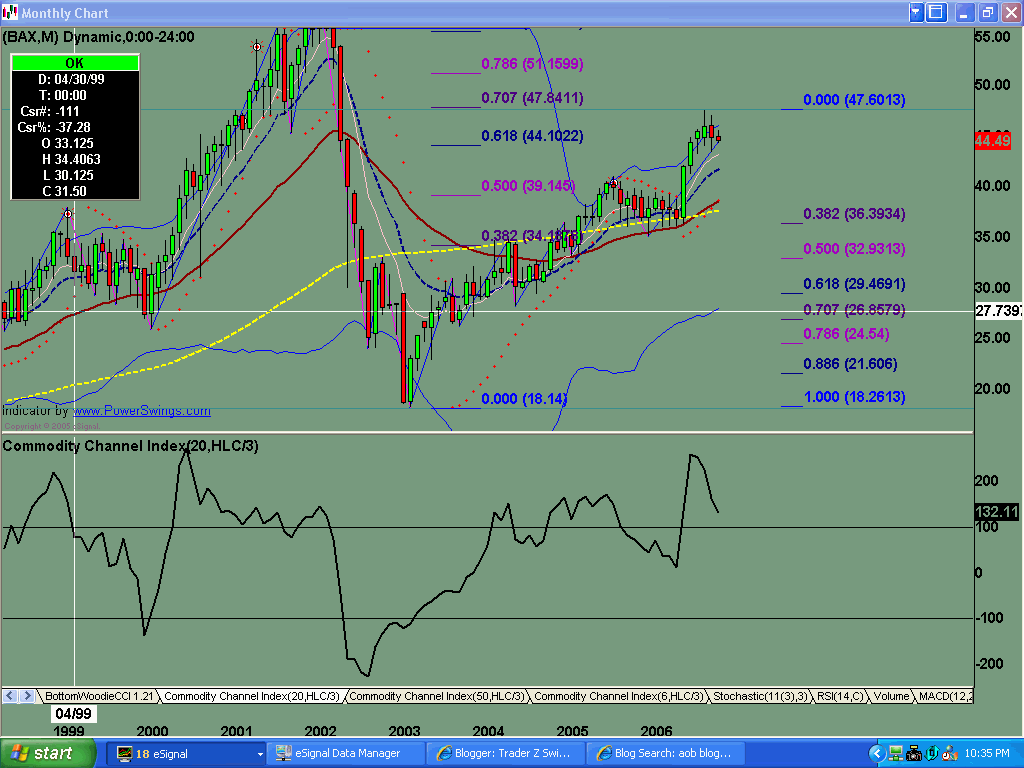
Possible 5 waves up into the .707 fib level. Bearish engulfing candle pattern in the overbought area.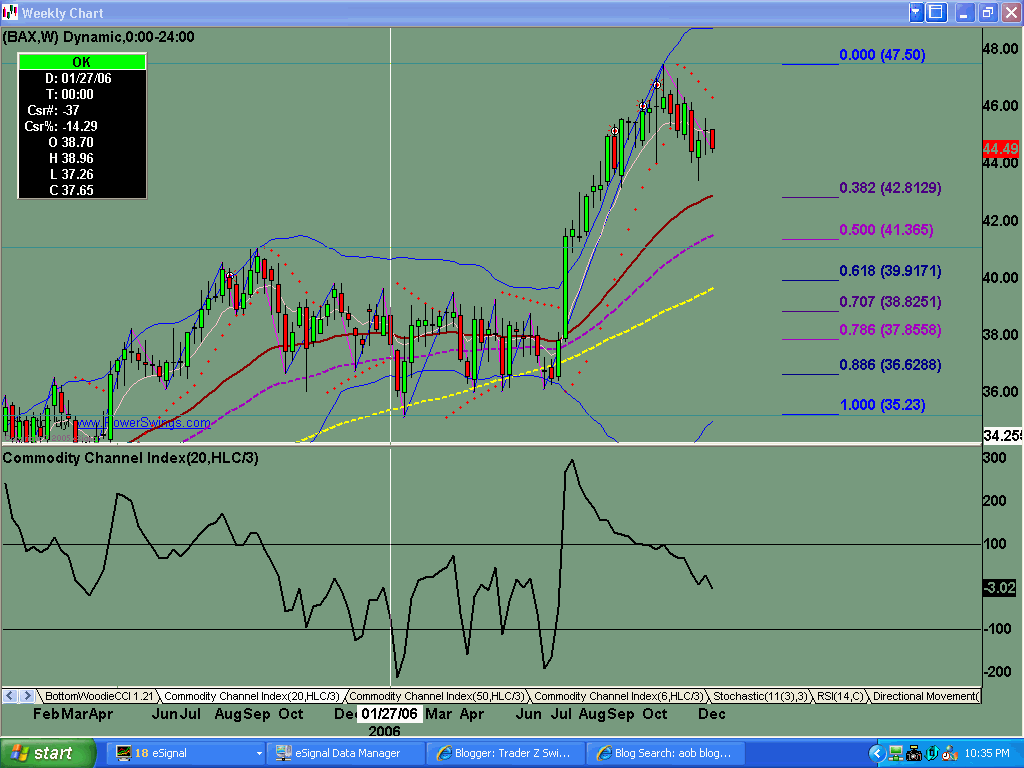
Indecision last week as evidenced by the doji.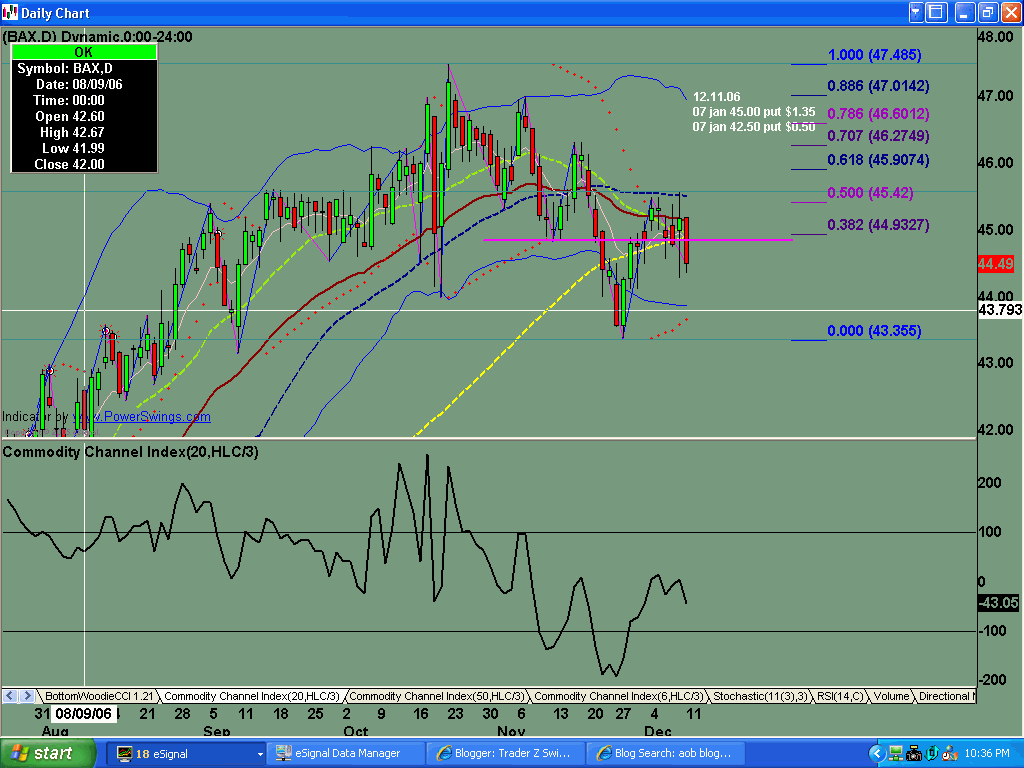
Selling started right at the open, and continued for most of the day. Currently trading below all the major moving averages. Look for continuation and test of the $43.35 area low.
Subscribe to:
Posts (Atom)

