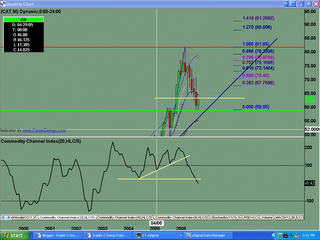
Monthly chart shows current short term support at the $59 price level. Uptrend remains intact. Still trading above the 34ema.
Weeky chart shows more clear that stock has found some short term support. It ended the week higher than last week. Possible 5 waves down, with wave extention in wave 3.
Buyers slowly stepping back into stock. Price closed above the LIS or prior support at the $62.00 level. This level needs to hold for further upside. Looking for gap fill and the 200sma if we can see more buying next week. IF we have 5 waves down, THEN I would expect some kind of abc or 3 wave pattern into the .618 to .786 fib levels.
Friday, November 24, 2006
CAT Analysis 11.24.2006
Posted by
TraderZ
at
11/24/2006 02:13:00 PM
![]()
Subscribe to:
Post Comments (Atom)

No comments:
Post a Comment