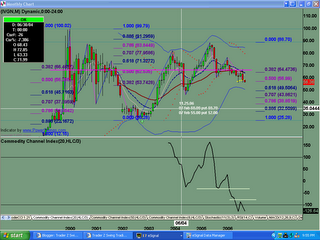
Monthly chart showing weakness so far. Possible wave c in a complex flat EW type of pattern. IF price breaks support, the downside tgt would be the .618 to .786 and test of low at $25.25 range.
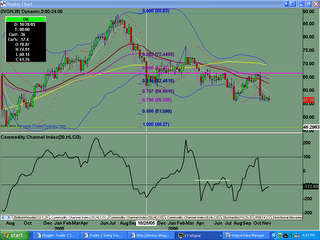
Current support here off a .786 fib level. IF this level breaks, look for lower. Watch the daily chart for evidence of buyers/sellers.
Possible double bottom here at the .786 fib level. No clear evidence of buyers stepping back in yet. Watch next few days of trading for buyers or sellers to tip their hand as to which way they wish to take it.
Saturday, November 25, 2006
IVGN Analysis 11.25.2006
Posted by
TraderZ
at
11/25/2006 07:04:00 PM
![]()
Subscribe to:
Post Comments (Atom)

No comments:
Post a Comment