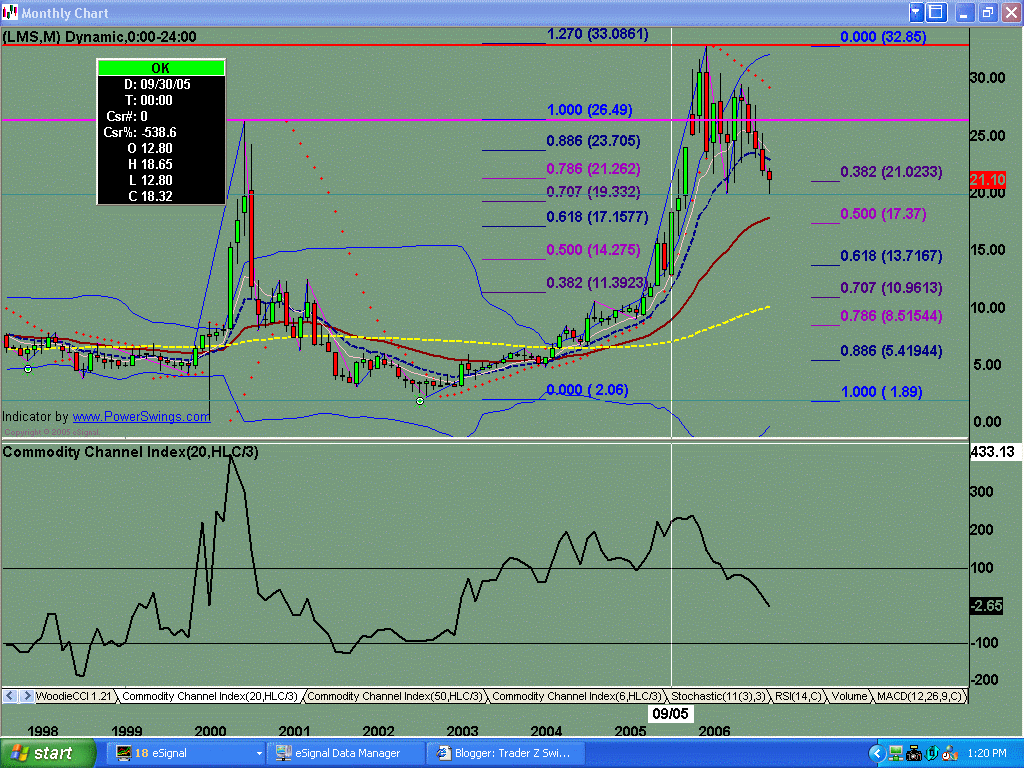
Monthly chart shows it made a top at the 1.27 fib level and a bearish engulfing candle. Currently, price has fallen below the prior high (LIS - line in sand) of $26.25
Weekly chart shows price to have found short term support. No clear buy signal as of yet.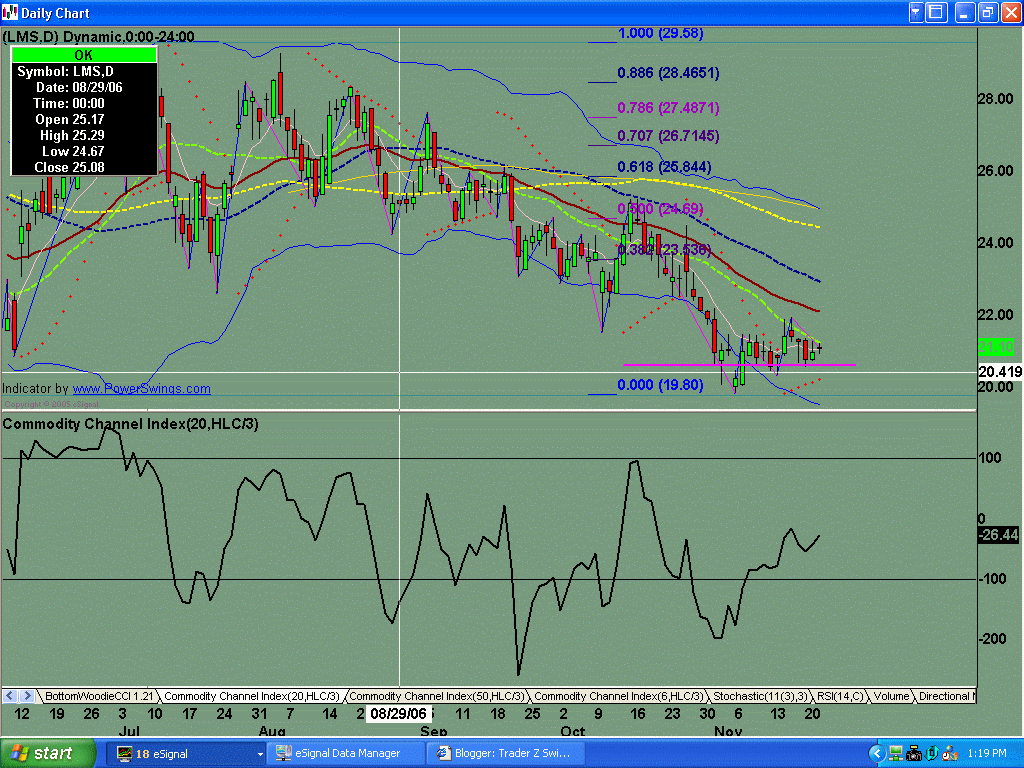
No strong buy signal on daily chart as of yet. Current support off the $20 level here. Watch for better buy signal, to indicate that buyers have stepped back into stock.
Friday, November 24, 2006
LMS Analysis 11.24.2006
Subscribe to:
Post Comments (Atom)


No comments:
Post a Comment