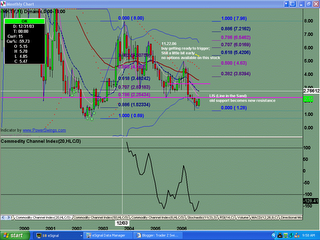
Monthly chart shows double bottom with bulls holding current support for current month. LIS (Line in the Sand) at $2.00 and $2.25. We need to clear that in order for more upside. WE have possible 5 waves down into current support from the $8.00 high.
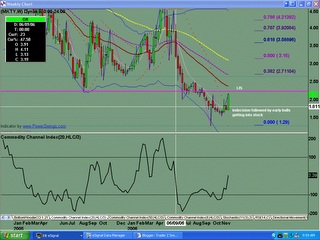
Weekly chart shows a better picture of early bulls slowing stepping back into the stock.
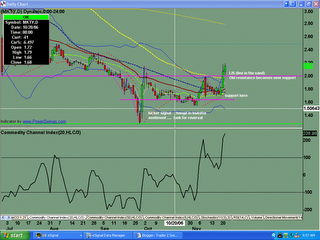
Kicker signal off the daily chart was the first big clue that investor sentiment has changed. We have now cleared the first LIS at $2.00. Next one to clear is the $2.25 before higher. Conservative tgt for this upmove is projected to be the 200sma, which also happens to be a .382 fib of the last move down from $5.00 high.
Thursday, November 23, 2006
MKTY Analysis 11232006
Posted by
TraderZ
at
11/23/2006 06:58:00 AM
![]()
Subscribe to:
Post Comments (Atom)

No comments:
Post a Comment