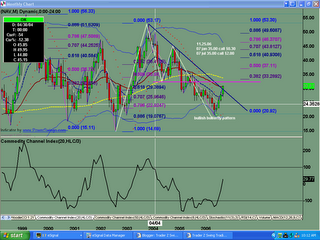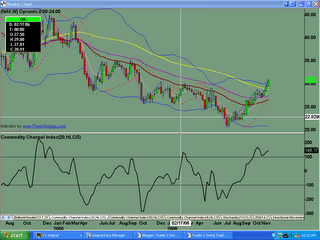
Monthly chart shows buyers coming back into the stock. Chart pattern is a bullish butterfly. 
Monthly chart finally trading above all the averages.
When there is a pullback, look for buying activity. Price now above the 200sma, and trending upwards nicely.
Saturday, November 25, 2006
NAV Analysis 11.25.2006
Posted by
TraderZ
at
11/25/2006 07:20:00 AM
![]()
Subscribe to:
Post Comments (Atom)

No comments:
Post a Comment