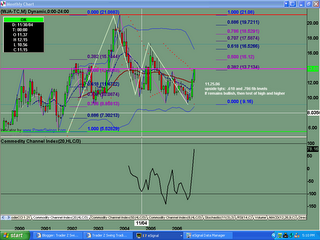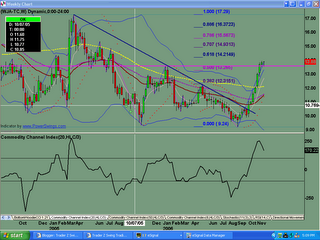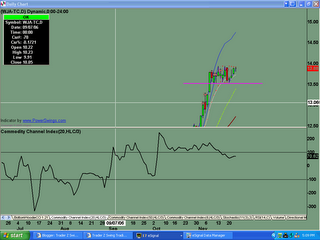
Monthly chart shows an abc corrective wave into the .786 level before finding support. This gives a bullish gartley pattern for the current move up. Stock ended the week testing prior s/r level at the $13.75 area.
On a weekly basis, buyers have been buying up the stock for the past 2 months or so.
Consolidation and profit taking the past couple of weeks.
Saturday, November 25, 2006
Westjet Airways (WJA-tc) Analysis 11.25.2006
Posted by
TraderZ
at
11/25/2006 02:17:00 PM
![]()
Labels: GARTLEY
Subscribe to:
Post Comments (Atom)

No comments:
Post a Comment