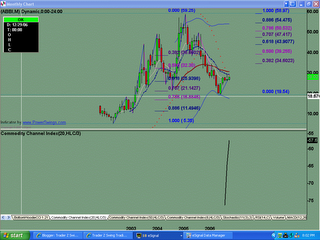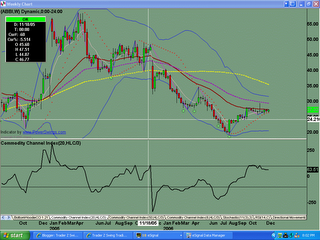
Monthly chart shows price made a retracement to the .707 fib level before finding support. Buyers started back into the stock in August 2006, as evidenced with a bullish engulfing candle pattern.
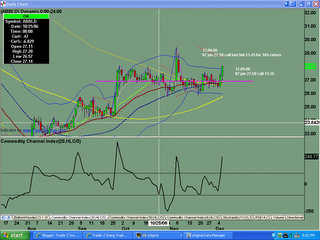
Short term support is currently at the $26.25 level. This level held as support for the past 10 weeks.

Bullish engulfing pattern yesterday indicated that buyers were stepping into the stock. Nice follow through today, with further buying and advancement in price.
Wednesday, December 06, 2006
ABBI Analysis 12.06.06
Posted by
TraderZ
at
12/06/2006 04:58:00 PM
![]()
Labels: ABBI, NANOTECHNOLOGY
Subscribe to:
Post Comments (Atom)

No comments:
Post a Comment