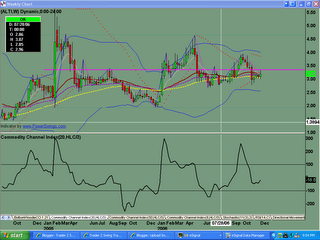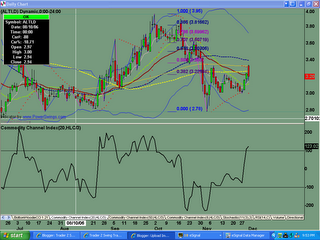
Monthly chart shows price stuck in a trading range. Each time the buyers stepped in, they were met with selling. November ended with a hammer type candle pattern right on support of the 34ema and mid-point of a large range candle.
While the monthly chart showed support, the weekly chart shows price to be bumping against resistance.
The week began with a morning star candle pattern, showing that early buyers are showing up. Friday started with a nice gap up and a test of the 200sma but ended with profit taking. Watch carefully early next week to see whether selling continues or not.
Saturday, December 02, 2006
ALTI Analysis 12.02.2006
Posted by
TraderZ
at
12/02/2006 06:52:00 PM
![]()
Labels: ALTI
Subscribe to:
Post Comments (Atom)

No comments:
Post a Comment