Monthly chart shows consolidation/trading range since the low in May 2003. There is an abc 3 wave retracement pattern up to the .382 fib level at $6.50 area. Price hasn't really been able to trade and hold above the $4.20 area. For the last 3 months, buyers have been met with selling. Current support is at $2.75 area.
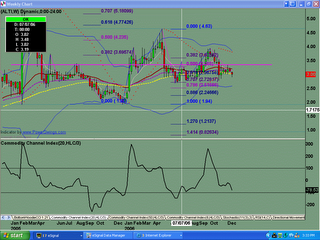
Weekly chart shows increased selling. Current resistance is at $3.35 area. Price currently trading below all moving averages.
Selling started about 2 weeks ago, with a gap up into the 200sm and the $3.35 resistance area identified off the weekly chart. If we can break the current lows at $2.75 area, look for .786 fib level as possible support.
Thursday, December 14, 2006
ALTI Analysis for 12.14.2006
Posted by
TraderZ
at
12/14/2006 12:31:00 PM
![]()
Labels: ALTI
Subscribe to:
Post Comments (Atom)

No comments:
Post a Comment