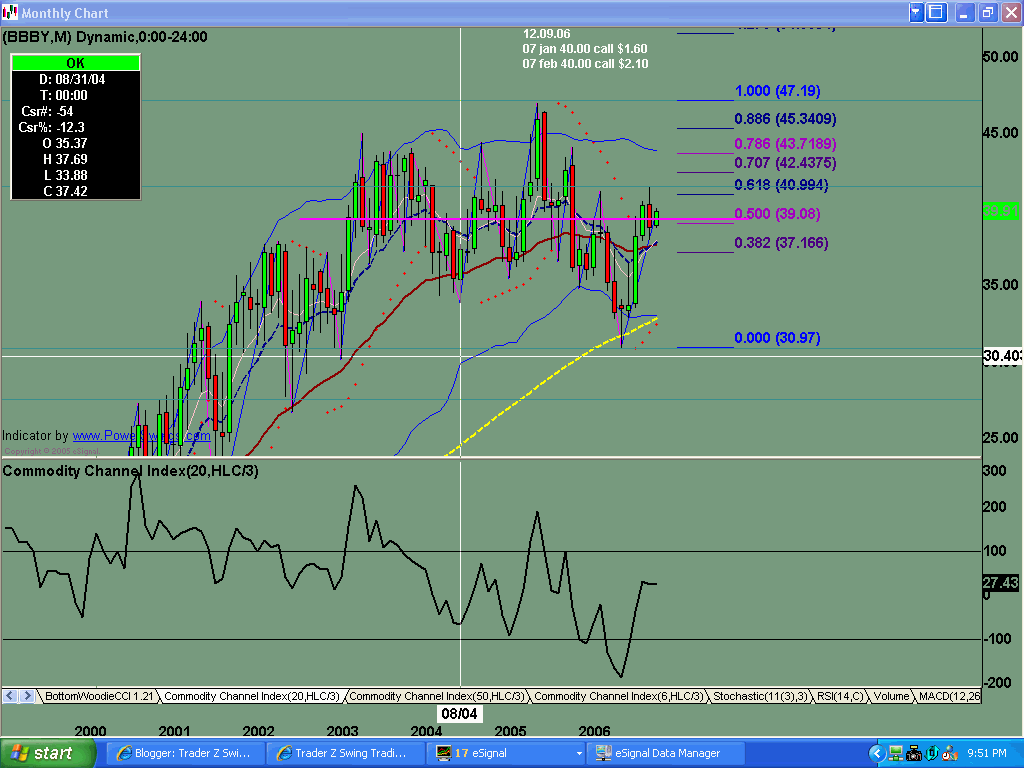
Monthly chart shows support off the 89sma, with 2 hammer candle patterns, then a cradle pattern. Possible 5 waves down into the $31 area of support.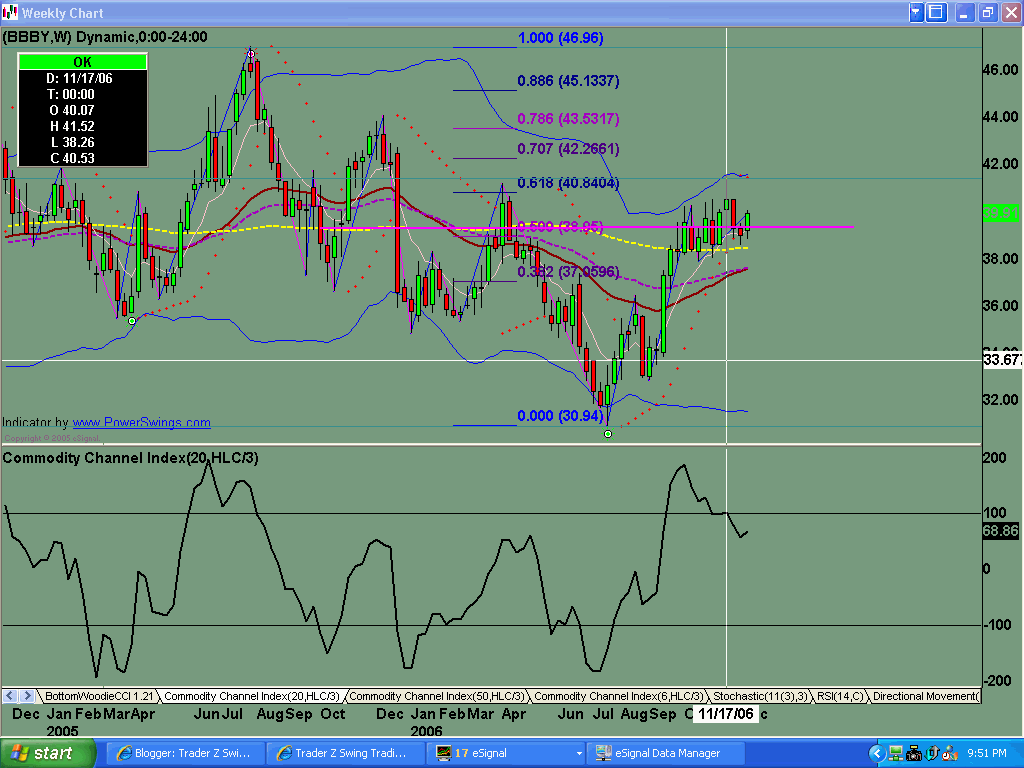
Buyers came back into the stock this week.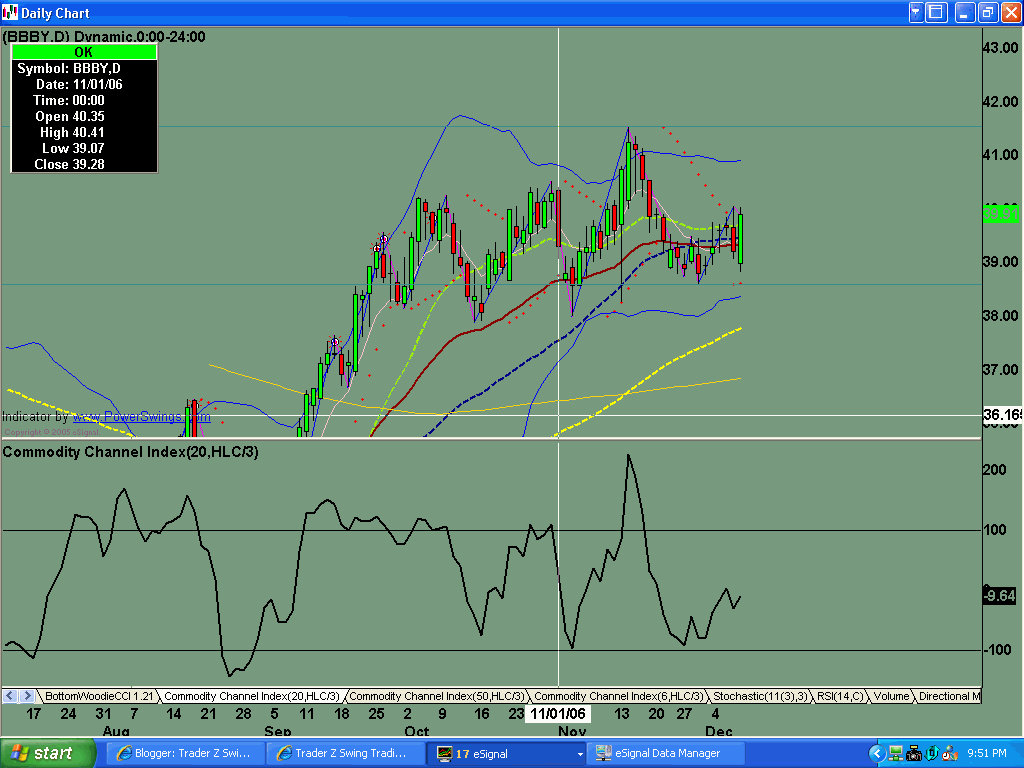
Indecision (as evidenced by the 4 dojis) followed by bears trying to sell were met with buying on Friday. We had a gap down, where all the sellers who wanted to sell have sold, and buyers came back in, and took price back up to clear near its highs for the day. This created a bullish engulfing candle right through the 20sma, 34ema, and 50sma. Look for continuation next week.
Saturday, December 09, 2006
BBBY Analysis for 12.09.06
Subscribe to:
Post Comments (Atom)


No comments:
Post a Comment