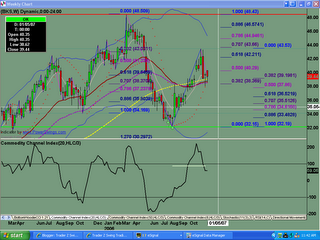
Bearish butterfly pattern formed into the 1.618 fib level. Possible 5 waves up from the $11.48 low. IF we have 5 waves up, THEN look for abc correction into .618 at $25.67 area. 
Resistance at the .707 fib level, with sellers showing up and making a bearish engulfing candle pattern to show that investor sentiment has changed. Current support off the cluster of moving averages .... 89sma, 34ema 13ema. Possible test of of $43.50 high before heading lower.
Profit taking off the $43.50 high brought out some early buyers on the pullback. Early buyers were met with more selling. Watch next week for confirmation of weakness.
Sunday, December 03, 2006
BKS Analysis 12.03.2006
Posted by
TraderZ
at
12/03/2006 08:43:00 AM
![]()
Labels: BKS
Subscribe to:
Post Comments (Atom)

No comments:
Post a Comment