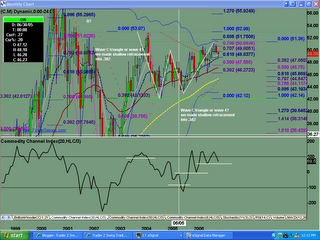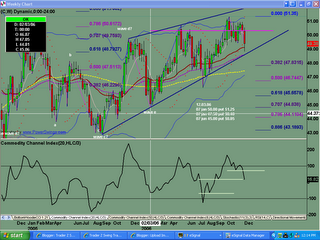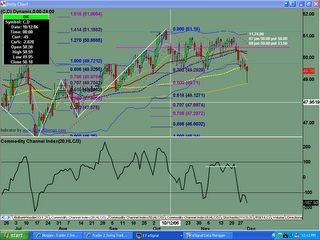
Bearish gartley butterfly into .786 fib level. Wave c has overlapping 5 waves. November brought out the sellers, resulting in a bearish engulfing candle pattern.
Rising wedge pattern with 5 waves. 
Friday brought out the early buyers right off the 200sma. Hammer candle pattern right off support. Watch early in the week to see whether or not more buyers come back into stock.
Sunday, December 03, 2006
C Analysis 12.03.2006
Posted by
TraderZ
at
12/03/2006 09:03:00 AM
![]()
Subscribe to:
Post Comments (Atom)

No comments:
Post a Comment