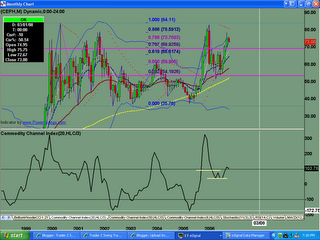
Monthly chart shows price remains stuck in a big congestion area/trading range, since July 2000. Once again, buyers try to test the high.
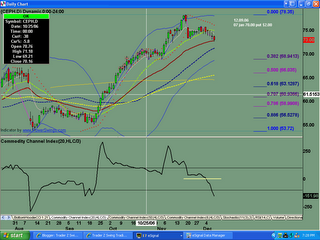
Weekly chart shows bearish gartley butterfly pattern into the .786 fib area. Buyers were met with sellers, resulting in a bearish engulfing pattern. Some indecision between buyers and sellers ended last week with the sellers gaining the upper hand.
Beginning of the week showed indecision, but soon resolved with sellers winning the battle. Look for test of $67 level where there is LIS.
Saturday, December 09, 2006
CEPH Analysis for 12.09.2006
Posted by
TraderZ
at
12/09/2006 04:21:00 PM
![]()
Labels: GARTLEY
Subscribe to:
Post Comments (Atom)

No comments:
Post a Comment