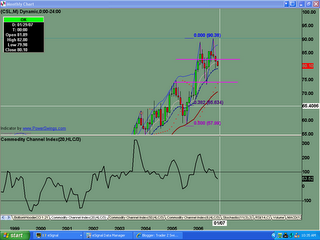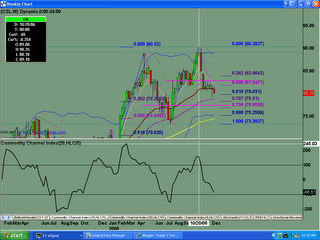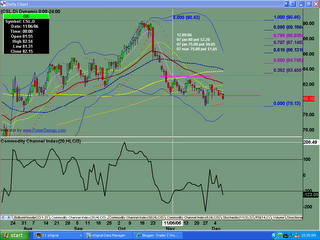
Monthly chart shows early signs of selling into the $90.35 high, with the topping tails in April and October. Bearish engulfing candle pattern in May served as early warning to take profits. Exuberant buying in August was met with selling. First clue was the hanging man, then the shooting star. Last 4 months have been controlled by the bears.
Four weeks of dojis shows indecision, with bears winning the past week.
Daily chart shows price trading below all major moving averages. Early buyers at support of the $79 area wer met with sellers. Look for continuation next week.
Sunday, December 10, 2006
CSL Analysis for 12.10.2006
Posted by
TraderZ
at
12/10/2006 07:37:00 AM
![]()
Subscribe to:
Post Comments (Atom)

No comments:
Post a Comment