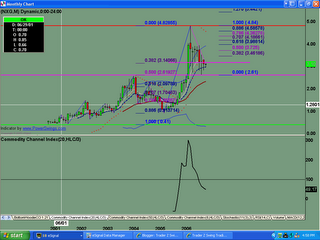
Monthly chart shows current support off an important LIS (line in the sand) at $2.58 range. This was the point of breakout to new highs into $4.82 where profit-taking took place. This current support area has brought out the early buyers back into stock.
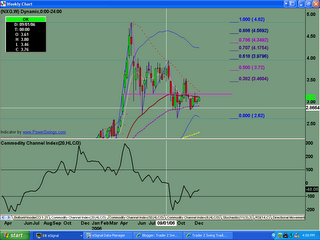
Weekly chart shows early buying off the $2.58 low, and short term overhead resistance at $3.50 area. Last week showed indecision between buyers and sellers. 
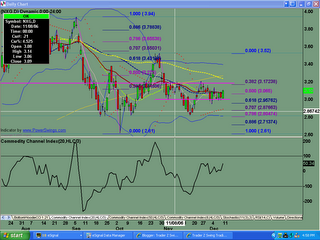
Daily chart shows a bullish gartley butterfly into a small .786 fib level. Early buyers started back intothe stock off $2.80 level, but were soon met with selling at the $3.20 area. Friday saw stronger buying, creating a bullish engulfing pattern. Last week's congestion shows indecision. Need to clear $3.20 decisively in order to be more bullish.
Tuesday, December 12, 2006
NXG Analysis for 12.12.2006
Posted by
TraderZ
at
12/12/2006 01:59:00 PM
![]()
Labels: GARTLEY
Subscribe to:
Post Comments (Atom)

No comments:
Post a Comment