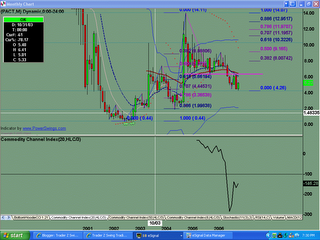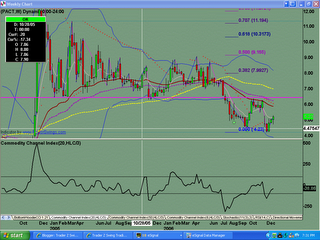
Monthly chart shows current support to be at a .707 fib level ... $4.26 area. Resistance above is at the $6.40 range. Price needs to clear that to see higher prices. Price has been stuck in trading range since December 2002.
Last 3 weeks has brought out early buyers... showing that $4.25 area is support short term.
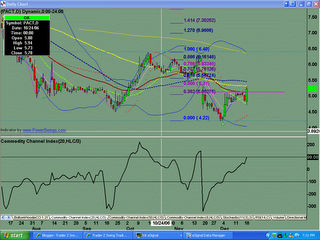
Buyers came out with strength today, as they managed to close above the prior resistance level at $5.13 area. Look for continuation upwards for remainder of week, with first upside tgt to be the resistance level at the $6.50 area, which also happens to be the 200sma.
Tuesday, December 19, 2006
PACT Analysis for 12.19.2006
Posted by
TraderZ
at
12/19/2006 04:32:00 PM
![]()
Labels: PACT
Subscribe to:
Post Comments (Atom)

No comments:
Post a Comment