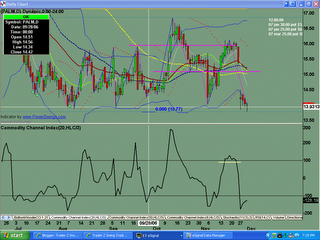
Monthly chart shows a 3 wave pattern into resistance at $24.91 high. The month of November saw more selling. Current Support is a small .786fib level at the $13 range.
Price remained in a narrow trading range since July. The weekly 34ema and also 89sma are currently acting as resistance, with more selling the past week.
More selling the past week saw the price gapped down below current support and all the major averages. Further selling on Friday was met with early buyers. Watch early next week to see whether or not more buyers are finally stepping back in.
Saturday, December 02, 2006
PALM Analysis 12.02.2006
Posted by
TraderZ
at
12/02/2006 04:25:00 PM
![]()
Subscribe to:
Post Comments (Atom)

No comments:
Post a Comment