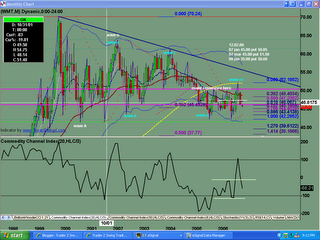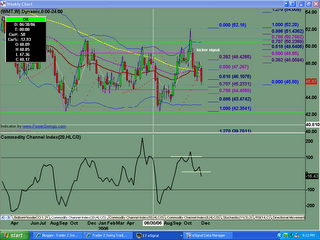
Monthly chart shows further weakness, with evidence of renewed selling for the month of November. Currently trading below the 34ema and the 89sma.
Current down move in price was started with a kicker signal. Renewed selling seen last week of November.
Daily chart shows kicker signal right at a small LIS (old support becomes new resistance), and the 34ema and 20sma. Price currently trading below the 200sma and 89sma. Friday ended with a hammer candle pattern in the oversold area, but at another LIS (old resistance becomes new support). Watch next week for clues as to whether buyers are stepping back in, or renewed selling.
Saturday, December 02, 2006
WMT Analysis 12.02.2006
Posted by
TraderZ
at
12/02/2006 06:13:00 PM
![]()
Labels: WMT
Subscribe to:
Post Comments (Atom)

No comments:
Post a Comment