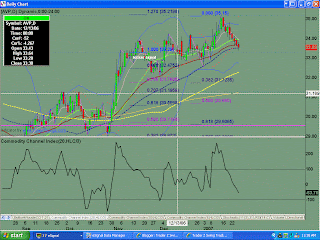
Monthly chart shows a 3 wave pattern bounce off the $24.43 low to current resistance at $35.11. Possible wave 4 pattern here.
Weekly chart shows a bullish butterfly pattern set up off the $26.12 low for the move up to the $35.12 resistance high. The current high is the butterfly target of 1.27 fib. This week completes an evening star type of candle reversal pattern with divergence. Look for follow through next week.
The daily chart shows nothing but selling this past week. Look for test of small LIS at $33.25 area, and then for it to break.
Sunday, January 28, 2007
AVP Analysis for 01.28.2007
Posted by
TraderZ
at
1/28/2007 08:31:00 AM
![]()
Subscribe to:
Post Comments (Atom)

No comments:
Post a Comment