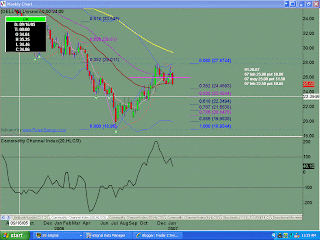
The drop down from the March 2000 high found support off the 89sma at the $16 area. From this low, price retraced to the .618 fib level of $42.50 in an abc 3 wave pattern. Wave C had extension of 5 waves within it. From the $42.50 area high, the price has dropped to the .886 fib level where it has found short term support. Current resistance is at a .382 fib level. This is a possible wave 4 for lower.
The weekly chart shows an evening star candlestick pattern right at the .382 fib level. Current test of top brought out more sellers this past week. IF this is a wave 4, THEN look for initial test of the low. First downside tgt is the .618 fib level at the $22.35 range and the .707 fib level at $21.55 range.
This past week brought out the sellers with a vengeance -- each day resulted in a gap down at the open. Friday found early buyers off prior resistance area of $24.80.
Sunday, January 21, 2007
DELL Analysis for 01.21.2007
Posted by
TraderZ
at
1/21/2007 08:27:00 AM
![]()
Labels: DELL
Subscribe to:
Post Comments (Atom)

No comments:
Post a Comment