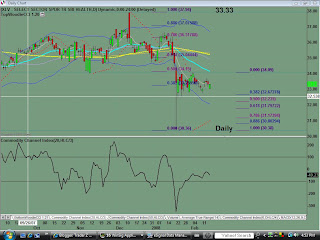
SELECT SECTOR SPDR HEALTH CARE ETF - XLV
Monthly chart shows current resistance at the $37.89 level with a bearish engulfing candle pattern in place. Price is currently just slightly above the prior high and key LIS of $32.93. The up trendline in place remains intact. Look for possible consolidation/trading range before next major move. 
Weekly chart shows an abc 3 wave pattern up into the current high. The large bottoming tail created by the trading activity for the week of January 25th, 2008 shows aggressive buying by early bulls. Price is currently holding at small support level of $32-$33. There is no buy signal/pattern evident on this time frame. 
Daily chart shows price to be in consolidation/trading range the past 3 weeks or so. Current resistance is at the .50 fib retracement level. Look for next week's trading activity to give better sense of direction.
Saturday, February 16, 2008
Health Care Analysis for 02.16.2008
Posted by
TraderZ
at
2/16/2008 01:44:00 PM
![]()
Labels: XLV
Subscribe to:
Post Comments (Atom)

No comments:
Post a Comment