S&P 500 INDEX - $SPX
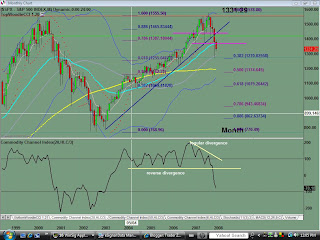
Monthly chart for this index is very similar to the one for the Dow Industrial Average. The index is currently below 1) 8ema, 2) prior support 3) uptrend line. Support is currently right at the .382 fib level. There has been nothing but selling the last 4 months, and the index has given all the gains of 2007. No buy signal/pattern evident on this timeframe. Eventual downside target is the 1079 level, which is the .618 fib retracement.
Weekly chart shows that last week's trading activity gave back all the gains of the prior week. This is not a good sign. Index is heading back down to test the January 22nd low and lower.
Daily chart shows index to be below all key moving averages. Last 3 trading days of the week were met with indecision between the bulls and the bears. No buy signal/pattern evident on this timeframe. Look for test of the low and lower.
Saturday, February 09, 2008
$SPX Update for 02.09.2008
Posted by
TraderZ
at
2/09/2008 09:00:00 AM
![]()
Labels: $SPX, Head and Shoulder
Subscribe to:
Post Comments (Atom)

No comments:
Post a Comment