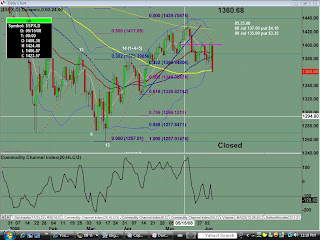
S&P 500 INDEX - $SPX
Monthly chart shows currently trading below its 8ema, and right at its 34ema for support. Selling pressure is increasing, as what little ground was made by the bulls in the month of April and May, have almost all been taken back by the bears.
Weekly chart shows strong selling pressure continuing, with the index trading below all its key moving averages on this timeframe.
Daily chart shows the evidence of strong selling pressure from Friday's trading session. Look for a retest of the March low and lower in the days/weeks ahead.
Saturday, June 07, 2008
$SPX Update for 06.07.2008
Posted by
TraderZ
at
6/07/2008 07:08:00 PM
![]()
Labels: $SPX
Subscribe to:
Post Comments (Atom)

No comments:
Post a Comment