BANK OF NOVA SCOTIA - BNS-TC
Monthly chart shows stock continues to remain weak, with overall selling pressure still in place during the month of December 2008. No buy signal/pattern evident on this timeframe.
Weekly chart continues to show weakness with selling pressure evident this past week. No buy signal/pattern evident on this timeframe.
Will there be confidence for much follow through to the upside next week? Price action so far looks more like consolidation/trading range being traced out.
TORONTO DOMINION BANK (TD) -TD-TC

Monthly chart shows continued weakness with bulls unable to get any traction to the upside. No buy signal/pattern evident on this timeframe.

Weekly chart shows selling pressure evident this past week. No buy signal/pattern evident on this timeframe.
Daily chart shows aggressive bulls stepped back into the stock during Friday's trading session. Will the bulls continue buying into next week?
CANADIAN IMPERIAL BANK OF COMMERCE (CIBC) - CM-TC
Monthly chart shows current support off the .786 fib retracement level. Current price action indicates indecision between the bulls and the bears. No buy signal/pattern evident on this timeframe.

Weekly chart shows bears gaining the upper hand this past week. Price remains below all key moving averages and the down trendline in place. No buy signal/pattern evident on this timeframe.
Daily chart shows bulls continue to make higher highs and higher lows. However, the price action indicates consolidation/trading range being traced out.
BANK OF MONTREAL - BMO-TC

Monthly chart continues to show selling weakness. No buy signal/pattern evident on this timeframe.

Weekly chart shows the bank ended the week with renewed selling. No buy signal/pattern evident on this timeframe.

Daily chart shows aggressive bulls stepped back into the market with Friday's trading session. Will they be able to hold current support and take the stock price higher?
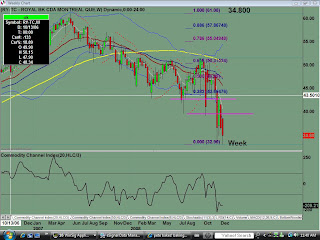
ROYAL BANK OF CANADA - RY-TC


No comments:
Post a Comment