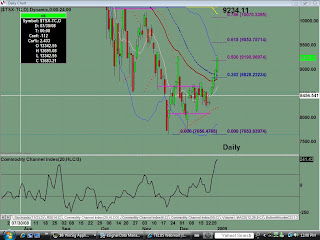
S&P/TSX INDEX - $TSX-TC
Monthly chart shows tradeable bottom is in place, right at the .786 fib retracement level and the key LIS (old resistance becomes new support). 
Weekly chart shows possible 5 waves down into current support. Last week's trading activity resulted in a strong close above the 8ema. Look for continued bear market rally into first upside target at the .382 fib retracement level.
Saturday, January 03, 2009
TSX-TC Update for 01.03.2009
Posted by
TraderZ
at
1/03/2009 02:01:00 PM
![]()
Labels: $TSX-TC
Subscribe to:
Post Comments (Atom)


No comments:
Post a Comment