S&P 500 INDEX - $SPX
Monthly chart shows short term bottom in place, as aggressive bulls stepped back into the market. The bulls managed to close the week right at the key LIS and October 2002 bottom. No buy signal/pattern evident on this timeframe as of yet.
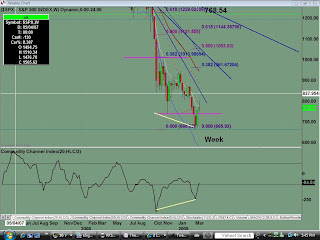
Weekly chart shows that last week's trading session ended in a doji/shooting star candle pattern as the upside momentum fizzled towards the end of the week. The bulls did however, manage to close the week above the small key LIS and s/r of the November 2008 low.


Weekly chart shows that last week's trading session ended in a doji/shooting star candle pattern as the upside momentum fizzled towards the end of the week. The bulls did however, manage to close the week above the small key LIS and s/r of the November 2008 low.

Daily chart shows profit taking/renewed selling pressure towards the end of the week. The bulls encountered resistance right at prior support of the January 2009 low. If the bulls are unable to gather upside traction, this will create a "blue ice failure" pattern.


No comments:
Post a Comment