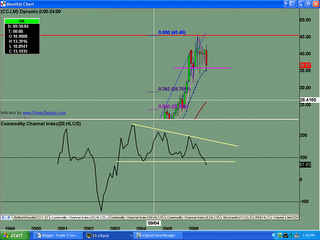
Chart sure looks a bit toppy. We have triple divergence off the CCI Indicator with a ghost and HTLB. We have major indecision as indicated by the dojis and spinning tops off resistance high of $45.34. Sure likes a warning to take profits if long from much lower. There is no buy signal off the monthly chart for any new longs.
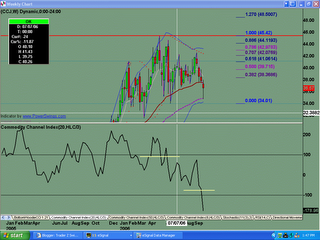
Weekly chart further shows major indecision with consolidation range. Market is testing the prior lows at the $34 range.
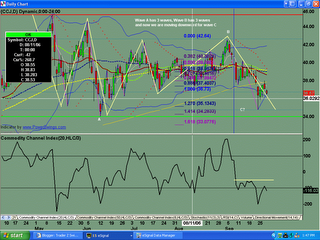
Price has been making a series of 3 wave patterns off the $45.34 high. We have not been able to break the high since May. On a daily basis, we are now trading below all moving averages, even the 200sma. Friday's close takes below the current s/r level and important LIS of $36.76. IF we break the current support of $34.01, THEN the next tgt for support will be $31.50, then $28.10 ish.
Sunday, October 01, 2006
CCJ Analysis 10.01.2006
Posted by
TraderZ
at
10/01/2006 11:03:00 AM
![]()
Subscribe to:
Post Comments (Atom)

No comments:
Post a Comment