 Daily chart looking a little toppy. Profit taking after nice big run up. Move up to new highs started with kicker type signal right off the 20sma. Daily chart showing regular divergence now.
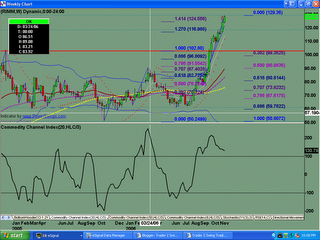
 Weekly chart looking a little toppy now. No sell pattern in place as of yet. Next upside target to look for potential reversal pattern is at the 1.618 fib level.
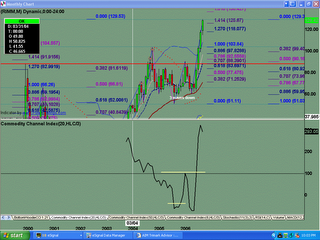
 Monthly chart shows very strong positive momentum behind it. Three wave corrective pattern indicates wave 4 type characteristics .... looking for higher high to complete wave 5.
Thursday, November 16, 2006
RIMM Analysis for 11.16.2006
Posted by
TraderZ
at
11/16/2006 07:11:00 PM
![]()
Subscribe to:
Post Comments (Atom)

No comments:
Post a Comment