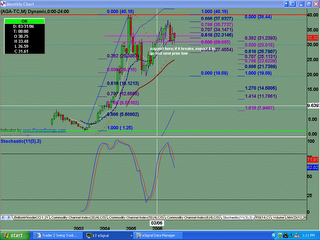
Monthly chart shows current support in the $31.00 range.
Weekly chart shows support off the 89sma. Last 2 weeks investors/traders have shown some indecision. The current support here needs to hold before it can go any higher.
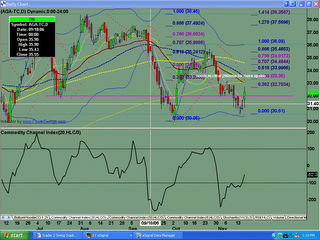
Daily chart shows investors/traders were undecided on Wednesday and Thursday. On Friday, the bulls came back in, buying up the stock with a gap open, and finishing higher for the day. Based on this price action, I would expect we should clear the 200sma and go higher. IF we cannot manage to hold onto support, THEN I expect it go down further, to test the $19.50 area low.
Sunday, November 19, 2006
Algoma Steel (AGA-tc) Analysis 11.19.2006
Posted by
TraderZ
at
11/19/2006 10:19:00 AM
![]()
Subscribe to:
Post Comments (Atom)

No comments:
Post a Comment