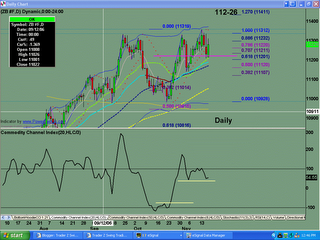
30 Year Bonds found support on friday off the 20sma, making a bullish engulfing candle pattern. Bulls are back, buying up the bonds. Currently price is still above the 34ema, 89sma, and the 200sma. 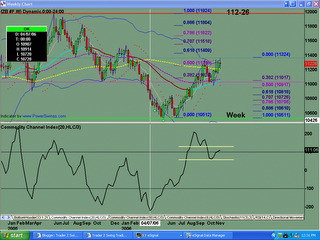
Weekly chart shows price to be above a key LIS (line in the sand - prior support area) and above the 34ema.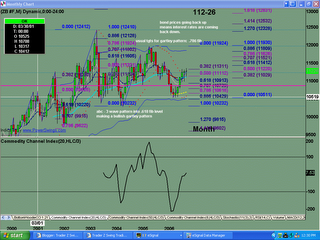
Monthly chart shows current market bias to the upside. IF prices go up, THEN interest rates go down.
Sunday, November 19, 2006
ZB #F (30 year bonds) Analysis 11.19.2006
Subscribe to:
Post Comments (Atom)


No comments:
Post a Comment