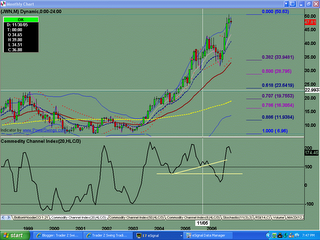
Monthly chart currently still looks bullish. Possible 5 waves up into current high. Watch the lower timeframe charts for more evidence of sellers than buyers.
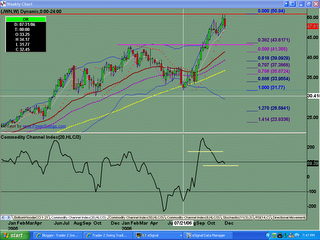
Weekly chart found support off the 89sma, making a bullish engulfing candle pattern for the current move up. Possible 5 waves up now into $50.79 high. Sellers came out in force, with profit-taking for the week.
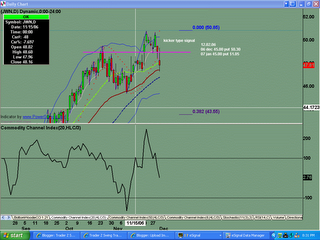
Last ditch effort of the buyers on Wednesday were met with sellers suddenly showing up the f0llowing day, with a gap down, and creating a kicker type signal. Definite change in investor sentiment, with follow through the following day (Friday).
Saturday, December 02, 2006
JWN Analysis 12.02.2006
Posted by
TraderZ
at
12/02/2006 04:47:00 PM
![]()
Subscribe to:
Post Comments (Atom)

No comments:
Post a Comment