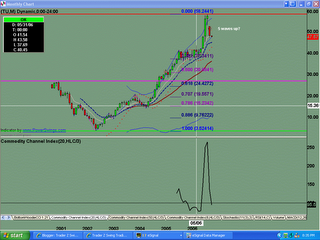
Monthly chart shows a hanging man candle pattern into $58.00 high. Last month the sellers came out in force, with the unexpected announcement of changes in the taxation of income trust by the Canadian federal government. Possible 5 waves up. IF we have 5 waves complete, THEN look for abc type correction to the .618 fib level, which also happens to be an area of support (LIS).
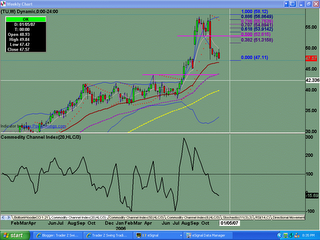
Sellers are trying to close the gap below, and found short term support at the $41 area. Current week showed that the selling was not done yet. 
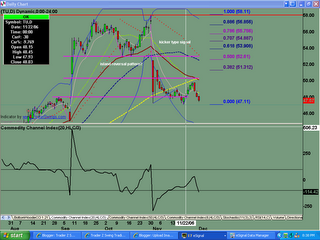
Resistance at the 34ema and 89sma with renewed selling, as evidenced by bearish engulfing candle pattern. Look for further weakness and more selling next week to confirm that the top has been put in.
Saturday, December 02, 2006
TU Update 12.02.2006
Posted by
TraderZ
at
12/02/2006 05:33:00 PM
![]()
Subscribe to:
Post Comments (Atom)

No comments:
Post a Comment